Richest Cities in New Mexico (2026)
by Kristen Carney
Updated: February 9, 2026
Richest City in New Mexico
The richest city in New Mexico is Hyde Park in Santa Fe County with an average household income of $412,402 as of 2024. While exceptionally affluent, Hyde Park only has a population of 189 as of 2024. The richest city in New Mexico with at least 5,000 people is White Rock in Los Alamos County with an average household income of $196,450 as of 2024 and 5,716 people as of 2024 according to the most current Census data available (citation).
| Rank | City | County | Population | Average Income | Median Income |
|---|---|---|---|---|---|
| 1 | Hyde Park | Santa Fe | 189 | $412,402 | $194,464 |
| 2 | La Tierra | Santa Fe | 315 | $362,946 | $246,008 |
| 3 | Puerto de Luna | Guadalupe | 378 | $334,503 | $250,001 |
| 4 | Las Campanas | Santa Fe | 2,119 | $285,472 | $204,922 |
| 5 | La Cueva CDP | Sandoval | 162 | $282,705 | $248,625 |
| 6 | Roy | Harding | 302 | $261,060 | $43,203 |
| 7 | Santa Fe Foothills | Santa Fe | 779 | $244,180 | $157,083 |
| 8 | Paa-Ko | Bernalillo | 743 | $239,373 | $230,804 |
| 9 | Encantado | Santa Fe | 175 | $232,320 | -$1 |
| 10 | Tano Road | Santa Fe | 1,586 | $222,562 | $183,162 |
| 11 | Sombrillo | Santa Fe | 168 | $212,520 | $243,750 |
| 12 | Stanley | Santa Fe | 185 | $208,361 | $221,082 |
| 13 | Sedillo | Bernalillo | 565 | $203,509 | $112,009 |
| 14 | Fort Wingate | McKinley | 726 | $199,778 | $250,001 |
| 15 | Organ | Doña Ana | 152 | $198,480 | -$1 |
| 16 | Conejo | Santa Fe | 555 | $197,551 | $111,908 |
| 17 | White Rock | Los Alamos | 5,716 | $196,450 | $156,639 |
| 18 | Sunlit Hills | Santa Fe | 899 | $183,274 | $126,250 |
| 19 | Sandia Heights | Bernalillo | 3,160 | $180,559 | $143,646 |
| 20 | Rio en Medio | Santa Fe | 69 | $165,033 | $200,250 |
Median Income versus Average Income: Which Should You Use?
We usually suggest using median income data – either instead of or in addition to – average income data as a true indicator of wealth. If you haven’t thought about median versus average since your last standardized test, you aren’t alone. Here’s what they are:
- average is the sum of a set of numbers divided by the count of numbers in the set
- median is the middle number in the set of numbers
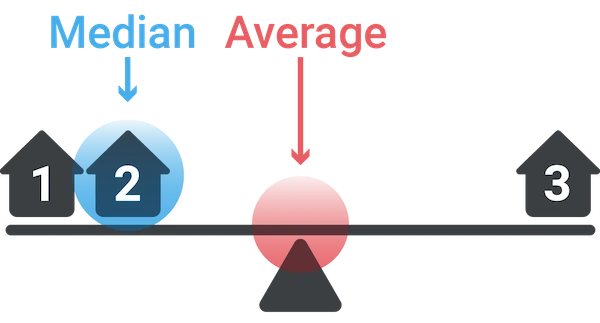
Now let’s say you had the following simplified set of income data.
Household 1: $30,000
Household 2: $50,000
Household 3: $1,000,000
The average income for this set is $360,000. The outlier data point ($1,000,000) skews the average WAY up. Conversely, the average income would be skewed WAY down if someone had an income of $500. The median income for the same data set is $50,000. Outlier data doesn’t skew the median.
Most Business Owners Should Use Median Income
So most business owners should use the median income as a true indicator of wealth, because it provides a more accurate representation of a typical income, especially in areas with significant income disparity.
When Should You Use Average Income
If your target market is high-income households, the average income may be more relevant. This is because the average income can highlight the presence of a higher concentration of wealthy individuals, which is beneficial for luxury goods and services marketing. We’re using average income on this page because using the Census’s highest reported median value of $250,001 could result in multiple ties for the richest geography.
Why do so many cities have a median value of $250,001?
The Census' American Community Survey uses $250,000+ as a jam value for median income estimates to protect privacy, ensure data consistency, and simplify reporting. A "jam value" in survey data refers to a placeholder or default value used when actual data points are unavailable, incomplete, or exceed certain thresholds. We represent this jam value as $250,001 to make it easy for you to sort.
You might also be interested in:
Email Me When New Data Are Released
Join thousands of subscribers and receive just 1 (ONE!) email a year in December when the US Census Bureau releases new income data for New Mexico richest cities.
SOURCES
United States Census Bureau. Annual Estimates of the Resident Population: April 1, 2020 to July 1, 2023. U.S. Census Bureau, Population Division. Web. May 2024. http://www.census.gov/.
United States Census Bureau. B01001 SEX BY AGE, 2024 American Community Survey 5-Year Estimates. U.S. Census Bureau, American Community Survey Office. Web. 29 January 2026. http://www.census.gov/.
United States Census Bureau. B19013 Median Household Income, 2024 American Community Survey 5-Year Estimates. U.S. Census Bureau, American Community Survey Office. Web. 29 January 2026. http://www.census.gov/.
United States Census Bureau. "DP03 SELECTED ECONOMIC CHARACTERISTICS." 2024 American Community Survey 5-Year Estimates. U.S. Census Bureau, American Community Survey Office. Web. 29 January 2026. http://www.census.gov/.
Products & Services
Plumbing
Connect
- 1-800-939-2130
- Contact Us
© Copyright 2026 Cubit Planning, Inc.